Summary: Latitude vs. "X"
Weather Trend Analysis Project
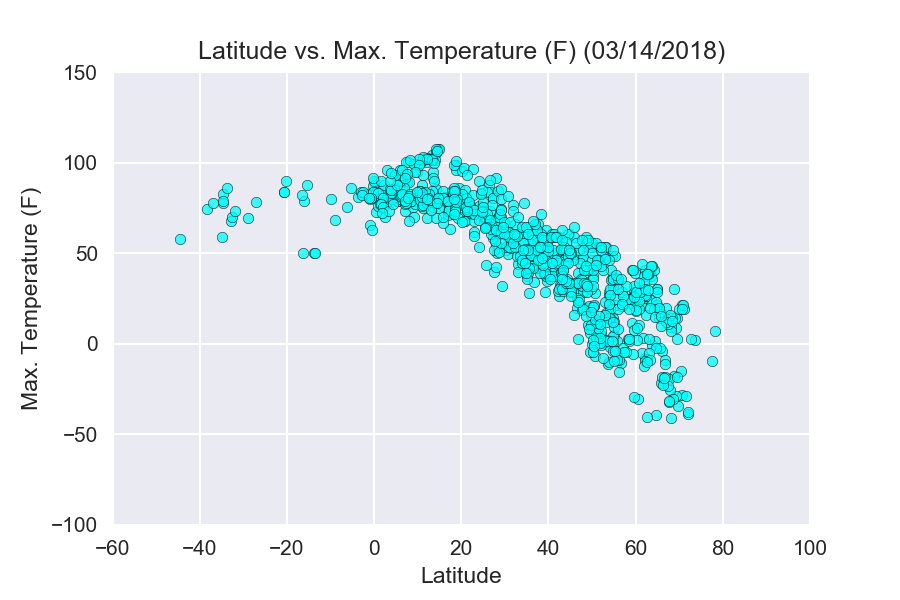
The scope of this project was to analyze how weather changes as locations approach the equator.
Weather indicators that were assessed in
this analysis include maximum temperature, cloudiness, humidity, and wind speed, for over 500 cities around the world. Using a dataset of over 500
unique latitude/longitude coordinate pairs, and the OpenWeather API, these weather indicators were identified, collected, analyzed and plotted.
The resulting analysis illustrates the trends observed for a given weather indicator, relative to the latitude of its city's location.
Visualizations
|
|
|
|
|